Title I of ESEA: Targeting Funds to High-Poverty Schools and Districts
This report is part of a series, Understanding and Improving Title I of ESEA.
What is Title I?
Need a refresher on all things Title I? Check out All4Ed’s explainer on the Title I program and why it matters for students and families.
¿Qué es el Título I?
¿Necesita un repaso de todo relacionado con el Título I? Consulte el explicador de All4Ed sobre el programa de Título I y por qué es importante para los estudiantes y las familias.

In front of his one-room schoolhouse, President Lyndon B. Johnson signed the Elementary and Secondary Education Act and said, “By passing this bill, we bridge the gap between helplessness and hope for more than 5 million educationally children.”
Title I, Part A (Title I) of the Elementary and Secondary Education Act (ESEA) is the primary source of federal financial assistance for K–12 education, supplementing state and local funding in schools with high concentrations of children from low-income families to enable these students to meet state achievement standards. By enacting Title I, in 1965, as part of Lyndon B. Johnson’s War on Poverty, Congress recognized that children from low-income families had greater educational needs and that school districts serving students living in poverty—especially large concentrations of these students—often lacked the resources to fully meet those needs. The school districts where these students lived warranted federal aid to improve their educational programs and in turn, student outcomes (for more, see “Research Demonstrating the Link Between School Poverty Rates and Student Achievement”).
Accordingly, the following declaration of policy was included in the initial ESEA:1Elementary and Secondary Education Act of 1965, Public Law 89-10, 89th Cong. (1965).
In recognition of the special educational needs of children of low-income families and the impact that concentrations of low-income families have on the ability of local educational agencies to support adequate educational programs, the Congress hereby declares it to be the policy of the United States to provide financial assistance (as set forth in this title) to local educational agencies serving areas with concentrations of children from low-income families to expand and improve their educational programs by various means (including preschool programs), which contribute particularly to meeting the special educational needs of educationally deprived children.
At its core, the law is a civil rights law enacted in a time of great federal advancement in that area. Its stated goal was an attempt to provide redress for the impact of systemic barriers that, to this day, continue to create large concentrations of poverty. Civil rights violations, redlining, and the like exacerbated the issue for families of color. Limited access to markets, quality infrastructure, and employment opportunities did the same for families in rural areas.
The Equality of Educational Opportunity (also known as the Coleman Report of 1966), written by Johns Hopkins University researcher James Coleman, set the standard for research in public education. Motivated by Section 402 of the Civil Rights Act of 1964, which required the Commissioner of Education to conduct a survey and report on “equal educational opportunities,”2 Brief Amicus Curiae on behalf of NAACP Legal Defense & Educational Fund, Inc. and the New York Civil Liberties Union, 2001 NY App. Div. Briefs 567, 19 (2001). (Paynter v. State) Coleman’s report found that, aside from individual student characteristics, “a school’s socioeconomic background is a strong determinant of its students achievement.” Since its publication, decades of study conclude that concentrations of poverty depress achievement at both the school and district levels.
More contemporary research further strengthens Coleman’s arguments on the impact of a school’s concentration of students living in poverty. In fact, research shows that the relationship between student achievement and school poverty is greater than its relationship with family poverty status.3J. Anderson, D. Hollinger, and J. Conaty, “Poverty and Achievement: Reexamining the Relationship Between Poverty and Student Achievement,” ERS Spectrum 11, no. 2 (1993). Notably, high concentrations of poverty affect all students in a school, not just those from low-income families.4Brief Amicus Curiae on behalf of NAACP Legal Defense & Educational Fund, Inc. and the New York Civil Liberties Union, 2001 NY App. Div. Briefs 567, 19 (2001).
Although Title I was intended to support children living in concentrations of poverty, Congress has struggled since the law’s inception to balance this intention with the political need to spread funding more broadly and, thereby, maximize public support for this critical funding. As James Guthrie described Title I in 1968, “From the poverty rationale, it was possible to deduce a distribution formula which met the classic political test of “something for everyone” while still retaining substantial value for education.”5See https://kappanonline.org/political-case-history-passage-esea-guthrie/ (accessed October 6, 2022). Thus, the original Title I formula, the Basic Grant, was and continues to be distributed to school districts where just 2% of students live in poverty.
While several attempts have been made since 1965 to strengthen the degree to which Title I supports children from low-income families, including the addition of three new distribution formulas, we find that Title I funds remain inadequately targeted across:
- Districts:6The term “district” refers to local educational agencies and charter schools that are local educational agencies. More than 70% of Title I funds are allocated to local educational agencies (LEAs) with a poverty rate7In this analysis, “poverty rate” refers to census data whereas “percentage of low-income students” refers to poverty according to section 1113 of ESEA as the number of children eligible for a free or reduced-price lunch under the Richard B. Russell National School Lunch Act (42 U.S.C. 1751 et seq.), the number of children in families receiving assistance under the state program funded under part A of title IV of the Social Security Act, or the number of children eligible to receive medical assistance under the Medicaid program, or a composite of such indicators. below 30%.
- Formulas: The percentage of Title I funds allocated to LEAs with the highest concentrations8In this analysis, “highest concentration” refers to the LEAs in the fifth quintile. of poverty is only marginally higher when using the three new distribution formulas (not more than 6.9 percentage points) than if only the original Basic Grant formula is used.
- Schools: Nearly two-thirds of public schools receive Title I funding, including one in four schools with a percentage of children from low-income families below 10%.
- Grade spans: Nearly all elementary and middle schools with 90% or more children from low-income families receive Title I funds, compared with 76.6% of such high schools.
Further, we find that schools with the highest concentrations of poverty too often miss out on Title I funding. In several states, many schools receive Title I funds even when there are schools with the highest concentrations of poverty (90% or more) in the state that do not receive Title I funds. Nationwide, 1,188 schools with fewer than 10% students from low-income families receive Title I funds, while 1,144 schools serving 90% or more students from low-income families do not.
This report provides a brief description of the Title I program and the historical and political context that created this complex funding approach.9A more detailed analysis of the formulas can be found in Title I of ESEA: How the Formulas Work. It then provides data demonstrating the degree to which Title I funding is targeted to districts and schools with the highest concentrations of poverty. It concludes by examining aspects of the formulas that aid or hinder their ability to target funds to children living in concentrated poverty that policymakers should consider to improve the progressivity of the program.
What Is Title I?
Title I Formulas
Title I grants are distributed to LEAs via formulas based primarily on the number of formula-eligible children10The formula child count is an estimate of children living in poverty in the United States. This is determined by using the Census Bureau’s Small Area Income Poverty Estimates program which provides annual estimates of income and poverty statistics for all school districts, counties, and states, the number of children who qualify for Temporary Assistance for Needy Families, and the number of children in foster care. living within a school district. Today, Title I has four separate grant formulas: the Basic Grant, Concentration Grant, Targeted Grant, and Education Finance Incentive Grant (EFIG) formulas. Each formula receives its own annual appropriation from Congress. However, once the funds reach LEAs, they are combined into an overall Title I allocation and must be used in accordance with Title I’s overall program requirements.
Title I grants were initially distributed through the Basic Grant formula. However, over time Congress added formulas to provide additional funding to LEAs with the greatest need, recognizing that the initial formula was insufficiently targeted to poverty. First, Congress added the Concentration Grant formula in 1978, which functions like the Basic Grant except that there is a much higher poverty threshold for LEAs to be eligible to receive funds. In 1994, Congress developed formulas for the Targeted Grant and EFIG. Congress chose to keep both proposals, along with the existing formulas, to provide more funding per formula child in school districts with higher concentrations of poverty.
Since the passage of the No Child Left Behind Act of 2001 (NCLB), Congress has maintained funding for the Basic and Concentration Grants at fiscal year (FY) 2001 levels, with excess appropriations evenly divided between the newer formulas, i.e., one-half of each additional dollar in Title I funding is distributed via the Targeted Grant and the other half via EFIG. Figure 1 shows the evolution of Title I appropriations across the four formulas over time.
Figure 1. Title I Appropriations by Formula, FY 1980 Through FY 202211Analysis of Department of Education Budget Tables and FY2023 Consolidated Appropriations Act
Common Characteristics of Title I Formulas
As discussed in greater detail in Title I of ESEA: How the Formulas Work, each Title I formula has distinctive characteristics (summarized in Table 1). However, all of them include a count of formula-eligible children aged 5 to 17 years in a school district multiplied by the adjusted average state per-pupil expenditure (adjusted SPPE), which attempts to reflect local differences in the cost of education.12R. Skinner and Leah Rosenstiel, Analysis of the Elementary and Secondary Education Act Title I-A Allocation Formulas: Factors, Design Elements, and Allocation Patterns, CRS Report R45141, Version 3. Updated (2018). R. Skinner, Title I Formulas: In Brief, CRS Report R44164, Version 4. Updated (2016). In the highest-spending states, the SPPE is adjusted to 120% of the national average per-pupil expenditure, while in low-spending states, the SPPE is adjusted up to 80% of the national average per-pupil expenditure level. However, EFIG uses a different method for adjusting SPPE, with an upper bound of 115% of national average per-pupil expenditure and a lower bound of 85%.
In the case of all four formulas, based on the annual congressional appropriation for each formula, the U.S. Department of Education determines an estimated LEA allocation, awards a cumulative amount to states, and then empowers states to suballocate funds to LEAs in accordance with the underlying federal estimate (except in the case of very small school districts or districts with changing boundaries, in which case the state has a level of discretion in making LEA-level allocations).
Table 1. Inputs and Rules for How the Four Title I Formulas Allocate Funding to School Districts
Basic Grant | Concentration Grant | Targeted Grant | Education Finance Incentive Granta | |
Eligibilityb | At least 10 formula children and at least 2% formula children | More than 6,500 formula children or at least 15% formula children | At least 10 formula children and at least 5% formula children | At least 10 formula children and at least 5% formula children |
Count of Formula-Eligible Children (Unweighted) | x | x | ||
Adjusted Version of State Per-pupil Expenditure | x | x | x | x |
Small State Minimum | x | x | x | x |
Hold Harmless | x | x | x | x |
Number or Percentage Weighted Count of Formula-Eligible Children (Nonlinear) | x | x | ||
State Equity Factor | Affects state- and district-level allocations | |||
State Effort Factor | Affects state-level allocations but not how those are distributed to districts | |||
Notes: | ||||
Basic and Concentration Grants
Despite the provision that new Title I appropriations (including the $1 billion increase in FY 2022) bypass the original formula, the Basic Grant formula continues to distribute more than one-third of all Title I dollars, receiving $6,459,401,000 in FY 2022. To be eligible for a Basic Grant, an LEA must have only 10 or more formula-eligible children and have a child poverty rate of 2% or greater. Once a district meets the eligibility criteria, its total count of formula children is multiplied by adjusted SPPE before the remaining formula factors (e.g., ratable reductions, small state minimums, and hold harmless provisions as described in Title I of ESEA: How the Formulas Work) determine each LEA’s allocation.
The Concentration Grant formula works similarly to the Basic Grant, except it has a much higher threshold for districts to be eligible: either 15% of school-aged children or 6,500 children living in the district must be formula eligible. The Concentration Grant formula does not consider a district’s concentration of students in poverty beyond the eligibility criteria. For example, just like with Basic Grants, an LEA with a 15% poverty rate will receive the same amount per formula child through the Concentration Grant formula as an LEA with a 95% poverty rate. In FY 2022, about 7.8% of Title I funds ($1,362,301,000) were appropriated for Concentration Grants.
Targeted Grants and Education Finance Incentive Grants
Instead of using stricter LEA eligibility criteria, the Targeted Grant and EFIG formulas include different factors intended to increase the proportion of Title I funding supporting children from low-income families and target relatively more aid to districts with particularly high concentrations of students in poverty. Both formulas use a “weighted formula child count” that provides LEAs with more money per formula child as the LEA’s poverty rate (or total number of formula children) increases. As the poverty rate or number of eligible children increases in an LEA, each formula child receives a greater weight in the total count of formula children for that school district. Once the weighted formula child count is determined, the Targeted Grant formula awards funds to districts in a manner similar to the Basic Grant, except that LEAs must have 10 or more formula children and a child poverty rate of 5% or greater (not 2%) to be eligible for a Targeted Grant.
The EFIG formula has additional features—an Effort Factor and Equity Factor. The Effort Factor is based on a comparison of per-pupil expenditures within a state and the state’s personal income per capita. It is intended to reward states for investing in K–12 education as a function of their ability to do so. States can see a plus or minus of up to 10% of estimated funds because of their relative “effort” as compared to other states (i.e., the minimum Effort Factor is 0.95, while the maximum is 1.05). The Equity Factor is based on a weighted coefficient of variation (WCV) in per-pupil expenditure disparity among LEAs in a state. The more variation in per-pupil spending across LEAs in a state, the greater the Equity Factor used to award EFIG funds in that state. The Equity Factor is also used in determining the weighted formula child count for each LEA; states with a higher Equity Factor use a lower set of weights when distributing EFIG to LEAs. The effect is to (1) reward states where total state and local per-pupil expenditures are relatively more equitable and (2) hyper-target and redistribute more EFIG funds to high-poverty school districts in states where total state and local per-pupil expenditures are relatively inequitable.13See https://sgp.fas.org/crs/misc/R44461.pdf p.11–15 (accessed October 6, 2022).
The weighted child counts used in Targeted Grants and EFIG, as well as the Effort and Equity Factors, are explained in greater detail in Title I of ESEA: How the Formulas Work. In FY 2021, both Targeted Grants and EFIG accounted for $4,857,550,000 or 27.6%, respectively, of Title I appropriations.
Allocation of Title I Funds From LEAs to Schools
Once Title I funds are distributed to LEAs, they have great discretionary control over how much is retained at the district level for administrative costs (there is no maximum amount set in statute, regulation, or guidance) and how the funds are allocated to individual schools.14See https://sgp.fas.org/crs/misc/R44461.pdf p. 15–17 (accessed October 6, 2022). LEAs are required to rank their public schools by their poverty rate as measured by the percentage of children eligible for the free or reduced-price lunch program, Temporary Assistance for Needy Families, Medicaid, or any combination thereof. Funds must first be allocated to schools in rank order of poverty from highest to lowest, down to 75%. To increase Title I funding to high schools, the Every Student Succeeds Act (ESSA), the latest iteration of ESEA, allows districts to lower this threshold to 50% for high schools.15For information on other policies included in ESSA to increase Title I funding for high schools, see Appendix A.
If funds remain after funding all schools with a poverty rate of 75% and higher, LEAs continue funding schools in rank order of poverty. However, they may choose to only fund schools at one or more grade level—elementary, middle, or high schools.
To be eligible for Title I funding, a school’s concentration of poverty must be 35% or above the district average. Funds are allocated to schools in proportion to the number of children from low-income families enrolled in the school. LEAs may choose to provide larger grants per low-income child to schools with higher poverty rates. If an LEA provides funds to a school with a poverty rate below 35%, the per-low-income child allocation must be at least 125% of the LEA’s per-low-income child allocation. LEAs must also provide funds to private schools based on the number of children from low-income families living in residential areas served by public schools receiving Title I funds.16For additional information on the allocation of Title I funds within districts, including funding for private schools, see https://oese.ed.gov/files/2020/07/essaguidance160477.pdf (accessed October 6, 2022) and https://www2.ed.gov/programs/titleiparta/wdag.doc (accessed October 6, 2022).
Title I Across LEAs
The overall distribution of Title I funds to LEAs closely aligns with the distribution of all children from low-income families17In this analysis, “children from low-income families” refers to formula-eligible children. across LEAs.18For this analysis, “lower poverty LEAs” is defined as those with a poverty rate below 30% and “higher poverty LEAs” is defined as those with a poverty rate at or above 30%. In other words, Title I funding is distributed proportionately; however, the funding is not distributed equitably as it was originally intended.
For example, as Figure 2 and Table 2 show, 32.9% of formula-eligible children live in LEAs with a poverty rate between 10% and 20%. These school districts receive 30.5% of Title I funds.19Approximately 75% of formula-eligible children are in these school districts and 30% is the 90th percentile of poverty. Similarly, 17.5% of formula-eligible children live in LEAs with a poverty rate20LEA level poverty data is determined based on the Census Bureau’s Small Area Income and Population Estimates program, children living in foster care programs, and those receiving Temporary Assistance for Needy Families. For more information, see Title I of ESEA: How the Formulas Work. between 30% and 40%. These school districts receive 20% of Title I funds. This pattern of Title I distribution would make sense if the sole goal were to allocate Title I funds to LEAs according to the proportion of children from low-income families they serve. However, because Title I (especially the newer formulas) is also intended to promote funding equity and provide relatively more funding to districts with especially high concentrations of poor students, LEAs with the highest poverty rates should receive an outsized percentage of Title I funds relative to the share of formula children they serve. This is not the case. Only 28.3% of Title funds go to the LEAs with the very highest concentrations of poverty (30% or higher). Yet one-quarter of all formula-eligible students live in these LEAs, meaning the degree to which Title I funds are targeted to students in communities with greater poverty is marginal at best.
Figure 2. Share of ESEA Title I Funds Allocated to LEAs by Poverty Rate Range, FY 2020
Table 2. Share of ESEA Title I Funds Allocated to LEAs by Poverty Rate Ranges, FY 2020
Poverty Rate Ranges | ||||||||
1 | 2 | 3 | 4 | 5 | 6 | 7 | ||
Poverty Rates <10.0% | Poverty Rates ≥10.0% but <20.0% | Poverty Rates ≥20.0% but <30.0% | Poverty Rates ≥30.0% but <40.0% | Poverty Rates ≥40.0% but <50.0% | Poverty Rates ≥50.0% but <60.0% | Poverty Rates ≥60.0% | All LEAs | |
Percentage Share of Total Grants | ||||||||
Total Title I Grants, FY 2020 | 7.8% | 30.5% | 33.5% | 20.0% | 4.6% | 3.0% | 0.7% | 100.0% |
Percentage of Children Counted in the Tiel I Allocation Formulas for FY 2020 | 9.8% | 32.9% | 32.7% | 17.5% | 3.9% | 3.1% | 0.0% (0.02%) | 100.0% |
Number and Percentage of All LEAs in Each Poverty Rate Range | ||||||||
Number of LEAs | 3,436 | 5,421 | 3,015 | 1,032 | 258 | 46 | 10 | 13,218* |
Percentage of All LEAs | 26.0% | 41.0% | 22.8% | 7.8% | 2.0% | 0.3% | 0.1% | 100.0%* |
Notes: Table reads, for example: LEAs with a school-age child poverty rate (children counted under the ESEA Title I allocation formulas as a percentage of all children aged 5 to 17 years) between 20.0% and 30.0% received 33.5% of total FY 2020 ESEA Title I grants, while 32.7% of all children counted in the Title I allocation formulas for FY 2020 resided in these LEAs. Table also reads, for example: A total of 3,015 LEAs have a school-age child poverty rate (children counted under the ESEA Title I allocation formulas as a percentage of all children aged 5 to 17 years) between 20.0% and 30.0%. These LEAs constitute 22.8% of all LEAs in the nation. The 114 LEAs in the Title I data file for FY 2020 that contain zero school-age children are excluded from this tabulation. | ||||||||
Title I Across Formulas
Specifically, as illustrated in Table 3, 24.7% of Basic Grant funding is allocated to LEAs with poverty rates of at least 30%. By adopting three new formulas to allocate Title I funds over time, Congress intended to increase the program’s targeting to districts with the most children from low-income families. However, the percentage of Title I funds flowing to the highest-poverty districts only increases slightly by formula; 29.1% of Concentration Grant funds, 29.5% of Targeted Grant funds, and 31.6% of EFIG funds are allocated to the highest-poverty LEAs. The percentage of Title I funds allocated to LEAs with the most significant concentrations of poverty through the more targeted formulas is only slightly higher (not more than 6.9 percentage points) than the percentage of funds allocated to these LEAs through the least targeted Title I formula.
Table 3. Share of ESEA Title I Funds Allocated to LEAs by Formula, FY 2020
Title I Formula* | Lower Poverty | Higher Poverty |
Total Title I Grants, FY 2020 | 71.8% | 28.3% |
Basic Grants (39.6% of FY 2020 Appropriations) | 75.2% | 24.7% |
Concentration Grants (8.4% of FY 2020 Appropriations) | 71.0% | 29.1% |
Targeted Grants (26.0% of FY 2020 Appropriations) | 70.4% | 29.5% |
EFIG (26.0% of FY 2020 Appropriations) | 68.4% | 31.6% |
Notes: *Totals do not equal 100% due to rounding. Table reads, for example: Approximately, 68.4% of all EFIG funds are allocated to LEAs with a poverty rate below 30%. | ||
Title I Across Schools
Our results also show that Title I funds are spread across a spectrum of schools. Of the 92,451 public schools during the 2018–19 school year, 63.1% received funding from Title I. As shown in Figure 3 and Table 4, one in four (25.6%) schools with a percentage of children from low-income families below 10% received Title I funds, as did nearly one-third (31.6%) of schools with a percentage of children from low-income families below 30%. The widespread receipt of Title I funds by schools with both high and low percentages of children from low-income families demonstrates local district choices to spread Title I funding widely among schools, and it reflects the consequences of making LEAs with very low numbers or concentrations of students from low-income families eligible to receive Title I dollars.
Figure 3. Percentage of Students from Low-Income Families (by School) vs. Percentage of All Schools in This Category Receiving Title I Funds, 2018–19 School Year21Data from the Common Core of Data (CCD) maintained by the National Center for Education Statistics.<br>Data includes regular schools only; it does not include special education or vocational schools. Within the CCD, a regular school is defined as a public elementary/secondary school providing instruction and education services that does not focus primarily on special education, vocational/technical education, or alternative education, or on any of the particular themes associated with magnet/special program emphasis schools.
Table 4. Percentage of Students from Low-Income Families (by School) vs. Percentage of Schools in This Category Receiving Title I Funds, 2018–19 School Year
Percentage of Students from Low-Income Families (by School) | Percentage of All School in This Category Receiving Title I Funds* |
<10.000% | 25.6% |
10.000–19.999% | 26.9% |
20.000–29.999% | 31.6% |
30.000–39.999% | 41.2% |
40.000–49.999% | 56.8% |
50.000–59.999% | 69.2% |
60.000–69.999% | 80.6% |
70.000–79.999% | 90.8% |
80.000–89.999% | 95.4% |
≥90.000% | 93.1% |
Notes: Data from the Common Core of Data (CCD) maintained by the National Center for Education Statistics, 2018–19 school year, http://nces.ed.gov/ccd/elsi/ (accessed November 13, 2020). Data includes public schools of the 50 states, District of Columbia, and Puerto Rico. Table reads, for example: The overall percentage of regular schools with a low-income student percentage of 30.000–39.999% that participated in Elementary and Secondary Education Act (ESEA) Title I during the 2018–19 school year was 41.2%. *Percentage of all regular schools that participated in ESEA Title I in the 2018–19 school year and met the selection criteria. • Schools where both the free and reduced-price lunch (FRPL) and the direct certification student count entries are blank or otherwise missing are excluded from this analysis. Schools of all enrollment sizes are included except those where total enrollment is zero. • Schools with a start of year operational status code of 2, 6, or 7 (i.e., closed, inactive, or future schools) are excluded. • Schools with all agency type codes except 6 (federal agencies) are included. • Schools where the 6-part Title I status code is missing are excluded. • FRPL percentage = number of FRPL students as a percentage of total enrollment. • Direct certification * 1.6 percent = number of direct certification students multiplied by 1.6 as a percentage of total enrollment. • Low-income student percentage = FRPL percentage where available, otherwise the direct certification * 1.6 percent where available. Data includes regular schools only; it does not include special education or vocational schools. Within the CCD, a regular school is defined as a public elementary/secondary school providing instruction and education services that does not focus primarily on special education, vocational/technical education, or alternative education, or on any of the particular themes associated with magnet/special program emphasis schools. | |
Title I Across Grade Spans
Title I funds are not distributed equitably across low-income schools with different grade spans. As demonstrated in Table 5, elementary and middle schools with high concentrations of children from low-income families are far more likely than similar high schools to receive Title I funds. For example, nearly all elementary and middle schools with 90% or more children from low-income families receive Title I funds, compared with 76.6% of such high schools.22See Appendix A.
Table 5. Percentage of Public Schools That Participate in ESEA Title I by School Low-Income Student Percentage and Grade Level, 2018–19 School Year
Low-Income Student Percentage | Percentage of Schools, by Grade Level, Participating in Title I | Schools by Grade Level and Low-Income Student Percentage | |||||
Pre-K | Elementary | Middle | High | Secondary | Other | ||
<10.000% | 25.6% | 1.8% | 24.9% | 29.5% | 25.3% | 0.0% | 41.8% |
10.000–19.999% | 26.9% | 4.1% | 30.8% | 26.2% | 17.6% | 10.7% | 37.1% |
20.000–29.999% | 31.6% | 6.5% | 42.4% | 23.6% | 15.5% | 11.5% | 42.3% |
30.000–39.999% | 41.2% | 7.2% | 58.7% | 28.0% | 19.3% | 13.2% | 64.0% |
40.000–49.999% | 56.8% | 11.8% | 78.3% | 38.7% | 26.2% | 21.9% | 77.4% |
50.000–59.999% | 69.2% | 10.2% | 87.8% | 52.7% | 37.6% | 35.5% | 87.0% |
60.000–69.999% | 80.6% | 10.4% | 93.9% | 65.2% | 53.2% | 66.7% | 88.0% |
70.000–79.999% | 90.8% | 22.5% | 97.7% | 85.4% | 74.5% | 57.7% | 90.7% |
80.000–89.999% | 95.4% | 33.3% | 98.7% | 95.5% | 84.3% | 85.7% | 92.3% |
≥90.000% | 93.1% | 34.1% | 97.9% | 93.1% | 76.6% | 56.8% | 94.0% |
All Schools | 64.5%* | 15.1% | 76.9% | 54.5% | 39.2% | 37.4% | 76.4% |
Notes: Table reads, for example: The overall percentage of regular schools with a low-income student percentage of 30.000–39.999% that participated in ESEA Title I during the 2018–19 school year was 41.2%. For regular schools differentiated by school level, the Title I participation rate during the 2018–19 school year for schools with a low-income student percentage of 30.000–39.999% was 7.2% for pre-K schools, 58.7% for elementary schools, 28.0% for middle schools, 19.3% for high schools, 13.2% for secondary schools, and 64.0% for other schools. Participation rates may be lower in pre-K schools because of the availability of other funding programs, e.g., Head Start, to support these schools. *Percentage of all regular schools meeting the selection criteria that participated in ESEA Title I during the 2018–19 school year. | |||||||
High-Income Schools Funded When Low-Income Schools Go Without
As described below and as illustrated in the fifty-state data depicted in Figure 6, school participation in Title I varies widely by state. In several states, schools with the highest concentrations of students from low-income families do not receive Title I funds even though schools with low concentrations of poverty do.23In this analysis, schools with the highest concentration of poverty are those with a poverty rate of 90% or more. Nationwide, 1,188 schools with a poverty rate below 10% receive Title I funds, while 1,144 schools with a poverty rate of 90% or greater do not receive Title I funding.
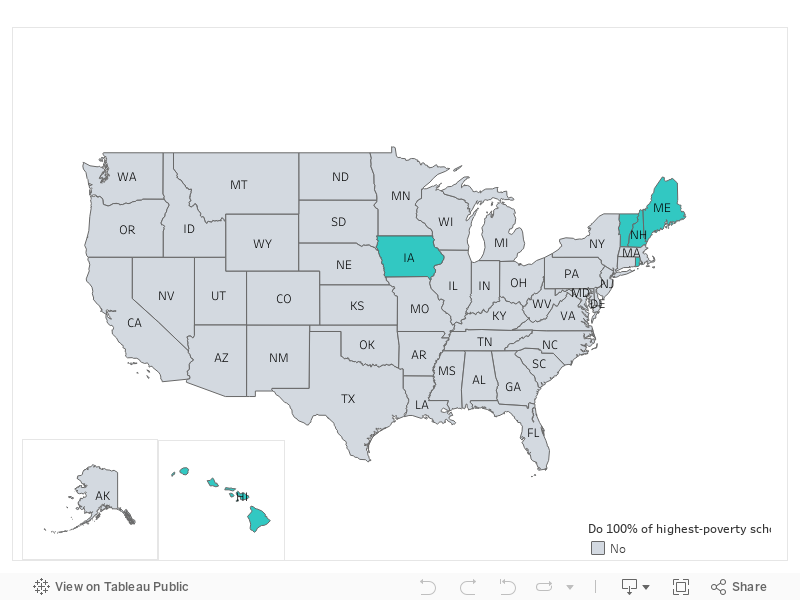
As Figure 4 demonstrates, all schools with the highest concentrations of poverty receive Title I funds in only six states (Hawaii,24Hawaii is one large LEA. Iowa, Maine, New Hampshire, Rhode Island, and Vermont). In Hawaii and New Hampshire, all schools where at least 80% of students are from low-income families also receive Title I funds. Vermont is the only state where all of its schools serving 60% or more students from low-income families receive Title I; in fact, only 20 schools in Vermont with a poverty rate above 30% do not receive Title I funds.25Vermont has 180 schools with ≥30.000% of students from low-income families Those not receiving funding are two schools between 50.000–59.999%, five schools between 40.000–49.999%, and 13 schools between 30.000–39.999%.
Figure 4. Title I Participation of All Highest Poverty Schools (≥90%), by State
It is likely that low-poverty schools receive Title I funds because, as described above and in the report Title I of ESEA: How the Formulas Work, the district eligibility criteria for three of the four Title I formulas is quite low. 95% of all LEAs receive Title I funds through the Basic Grant, which has the most relaxed eligibility criteria for districts. School districts only need a poverty rate of 2% (and 10 children from low-income families) to receive a Basic Grant and a poverty rate of 5% (and 10 children from low-income families) to receive a Targeted Grant and EFIG. In addition, as noted above, the school eligibility criteria for receiving Title I is low, which enables low-poverty schools to receive Title I funds. Schools are eligible if they have a poverty rate above the district average regardless of whether the district average poverty rate is high or whether the district barely meets the Title I eligibility thresholds. As a result of these policies, low-poverty districts are likely to provide low-poverty schools with Title I funds.
Conversely, in the vast majority of states, some of the highest-poverty schools do not receive Title I funds. North Carolina has the largest number of nonparticipating, high-poverty schools, with 128, or approximately 15% of such schools, excluded. In five states (Kentucky, Maryland, North Dakota, West Virginia, and Wyoming), more than one-quarter of their schools with the highest concentrations of poverty do not receive Title I funding26Kentucky, 54.84% (17 of 31); Maryland, 27.73% (66 of 238); North Dakota, 31.25% (10 of 32); West Virginia, 100% (0 of 1); and Wyoming, 36.36% (4 of 11).In Kentucky, more than one-half (55%) of such schools are not funded.27At 100%, West Virginia has the highest percentage of schools with a percentage of students from low-income families of 90% that does not receive Title I. However, the state only has one school in this category
On the other end of the spectrum, it is likely that high-poverty schools do not receive Title I funding because districts run out of money before they are able to fund all of their high-poverty schools. As described above, districts rank-order their schools from highest to lowest percentage of students from low-income families and then fund schools in order of their poverty rates. Districts determine the amount of funds to provide each school; there is no requirement for districts to provide a certain amount per pupil, or for districts to provide funds to each school within a particular poverty rate range. To provide a meaningful level of funding to some high-poverty schools, it is likely that high-poverty districts will lack sufficient Title I allocations to provide Title I grants to all of their high-poverty schools, especially in districts with many high-poverty schools.
Even more alarming, as a result of the formula rules and insufficient funding, in most states, schools with very low concentrations of poverty receive Title I funds even though schools with the highest concentrations of poverty do not. Figure 5 shows that in 36 states, at least one school28Arizona and Virginia are the only states where only one high-income school participated. with a poverty rate below 10% receives Title I funds while at least one school29Montana (1 of 8) and West Virginia (1 of 1) are the only states where only one high-poverty school did not participate. with a poverty rate of 90% or above does not.30[1] Alaska, Arizona, Arkansas, California, Colorado, Connecticut, Delaware, Florida, Georgia, Idaho, Illinois, Indiana, Kansas, Kentucky, Louisiana, Massachusetts, Michigan, Minnesota, Missouri, Montana, Nebraska, New Jersey, New Mexico, New York, North Carolina, North Dakota, Ohio, Oregon, Pennsylvania, South Dakota, Tennessee, Texas, Utah, Virginia, Washington, and Wisconsin. In Ohio, 278 schools with a poverty rate below 10% receive Title I funds even though 111 schools with a poverty rate of 90% or above do not.
Figure 5. Participation of Lowest-Poverty Schools, by State
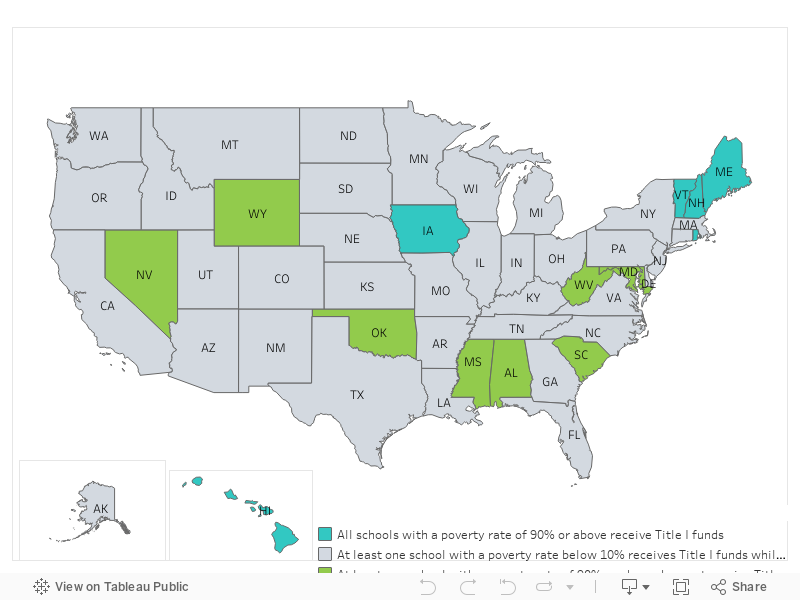
In addition to the 36 states, eight states (Alabama, Maryland, Mississippi, Nevada, Oklahoma, South Carolina, West Virginia, and Wyoming) have schools with a poverty rate of 90% or greater that do not receive Title I funds but zero schools with a poverty rate below 10% that do receive Title I funds. See Figure 7 for a 50-state overview of the number of schools with a poverty rate below 10% and above 90% that do and do not receive Title I funding.
Because Title I funds are allocated by states to districts, and then by districts to schools, there is no mechanism for ensuring all of a state’s high-poverty schools are funded before funding is allocated to low-poverty schools. In addition to the eligibility criteria that provide Title I funds to nearly all districts, districts vary greatly in size and number among the states, which can influence whether high-poverty schools are likely to be located in high-poverty districts or whether high-poverty schools are located in districts with average or below-average poverty rates.
Relatedly, as discussed in Title I of ESEA: How the Formulas Work, some of the formulas enable districts with larger child populations to receive more Title I funding per formula child compared to smaller districts with the same formula child share. These dynamics could make it easier for large districts to fund most of their high-poverty schools relative to smaller districts. Further, the Title I formulas tend to send more money, all else equal, to states with higher adjusted spending per pupil, which tend to have lower concentrations of poverty. This may make it more challenging, in particular, for districts in low-spending states to provide Title I funds to all of their high-poverty schools. Together, these dynamics mean that districts with many high-poverty schools may not have enough Title I funds to provide grants to all of them, and low-poverty districts in the same state may have Title I funds that are likely to be provided to low-poverty schools. Thus many states have low-poverty schools that receive Title I funding while high-poverty schools go without.
Policies Contributing to Inadequate Title I Targeting
Inadequate targeting of Title I funds to high-poverty schools may be the result of several factors, ranging from the way Congress allocates funds across the four Title I formulas to intricate details within each formula. Some of these details—such as the use of adjusted state per-pupil expenditure (SPPE) and methods for counting formula children in the district—are well-intentioned. However, they have unintended consequences that could diminish how well funds are targeted to students living in poverty. Others, such as the “poverty quintiles” used in the Targeted Grant and Education Finance Incentive Grant (EFIG) formulas are outdated and worthy of revision.
The Role of Formula Eligibility Criteria
As described above, the district eligibility criteria for three of the four Title I formulas is quite low. As a result, as noted in Title I of ESEA: How the Formulas Work, 95% of all LEAs receive Title I funds through the Basic Grant, which only requires districts to have a 2% poverty rate and 10 formula-eligible children to receive a grant, and nearly 89% of LEAs receive Targeted Grants and EFIG which only require districts to have a 5% poverty rate and 10 formula-eligible children. In contrast, fewer than one-half of districts (46.4%) receive Concentration Grants, where the eligibility criteria are higher; the LEA must have more than 6,500 formula children or at least 15% formula children.
In addition, the school eligibility criteria for receiving Title I is low, which also enables low-poverty schools to receive Title I funds. Schools are eligible if they have a poverty rate above the district average—regardless of whether the district average poverty rate is high or whether the district barely meets the Title I eligibility thresholds. As a result of these policies, low-poverty districts are likely to provide low-poverty schools with Title I funds.
The Role of Formula Structures
The structures of the four grant formulas used to determine Title I funding allocations include several factors that play a role in directing funds to lower-poverty districts: adjusted SPPE, the formula child count, small state minimums, and hold harmless provisions.
Adjusted State Per-Pupil Expenditure
As discussed in Title I of ESEA: How the Formulas Work, all four formulas include a measure of state spending on education, i.e., an adjusted version of each state’s average per-pupil expenditure for public K–12 education.31For most Title I grants, in the highest-spending states, the SPPE is adjusted to 120% of the national average per-pupil expenditure, while in low-spending states, the SPPE is adjusted up to 80% of the national average per-pupil expenditure level. However, EFIG uses a different method for adjusting SPPE, with an upper bound of 115% of national average per-pupil expenditure and a lower bound of 85%. This factor was intended to address the different cost of education and variable cost of living from one state to another when creating a national formula. For example, it likely costs much more to educate a child, on average, in a major metropolitan city versus a small rural town.
Although it receives relatively little attention, the use of adjusted SPPE has a major impact on the distribution of Title I grants. It is incorporated into each of the Title I formulas so that it acts as a “weight” that is applied to the count of formula children (described below). As a result, Title I grants among the highest-spending states are much higher (35% higher among Basic Grants and 50% in the other three grants) than in the lowest-spending states.32R. Skinner and Leah Rosenstiel, “Analysis of the Elementary and Secondary Education Act Title I-A Allocation Formulas: Factors, Design Elements, and Allocation Patterns. CRS Report R45141, Version 3. Updated” (2018). Further, states with more child poverty also tend to have lower per-pupil expenditures and thus, lower adjusted SPPE, which results in lower Title I allocations in those states, all else equal. Therefore, the use of adjusted SPPE in the formulas disadvantages children from low-income families in low-spending states.
Formula Child Count
Another impactful formula structure is the mechanism for calculating the formula child count in each of the four formulas. In Basic and Concentration Grants, a simple, numerical formula child count is used as the multiplier for adjusted SPPE. However, in the Targeted Grant and EFIG formulas, determining the formula child count is more complicated. The formulas consider both the number of formula-eligible children and the poverty rate in an LEA to produce a weighted formula child count. As detailed further in Title I of ESEA: How the Formulas Work, in both the Targeted Grant and EFIG formulas, a weighted formula child count is produced based on the number of formula-eligible children in the district (number weighting) as well as the percentage of formula children (percentage weighting), with children receiving a greater weight as the overall count or percentage of formula children in the district increase. Whichever weighted formula child count is larger for the district (the weighted count produced by number weighting versus the weighted count produced by percentage weighting) is used to determine the LEA’s Targeted Grant and EFIG allocations.
Because of the weights used to calculate the weighted formula child count using number weighting versus percentage weighting, in practice, large LEAs with relatively low poverty rates (but large numbers of formula-eligible children) are favored in the Targeted Grant and EFIG formulas. Figures 6-8 in Title I of ESEA: How the Formulas Work demonstrate how number weighting benefits larger districts. Tables 9 and 10 in Appendix B here provide further evidence. In Table 9, the per-formula child allocation for the nation’s 15 largest LEAs is compared with the per-formula child allocation of other LEAs in the same state. We find the Targeted Grant and EFIG per-formula child allocation in these 15 LEAs to be substantially larger than the per-formula child allocation in the LEAs in the same state with the highest poverty rate.
For example, the LEA with the largest number of formula children in one state (District A) has 86,671 formula children, a poverty rate of 21.7%, an EFIG per-formula child allocation of $484, and a Targeted Grant per-formula child allocation of $581. The LEA in that state with the highest poverty rate (District B) has 3,162 formula children, a poverty rate of 43%, an EFIG per-formula child allocation of $382, and a Targeted Grant per-formula child allocation of $458. In other words, District B has twice the poverty rate of District A. However, District B’s EFIG and Targeted Grant per-formula child allocations are each 21% less.
Table 10 further illustrates how EFIG and Targeted grants favor LEAs with large numbers of students from low-income families but relatively low poverty rates. We analyze data for three states (Florida, Maryland, and Virginia) that have relatively large, countywide LEAs, and thus, large numbers of LEAs with large formula child populations but low percentages of high numbers, as well as LEAs with both large formula child populations and percentages of formula children. The findings are striking. For example, the largest LEA in one state (District 1) has 13,109 formula children, a poverty rate of 6.7%, an EFIG per-formula child allocation of $628, and a Targeted Grant per-formula child allocation of $529. Another district in the state (District 2) has 9,113 formula children, a poverty rate of 34.2%, an EFIG per-formula child allocation of $539, and a Targeted Grant per-formula child allocation of $484. In other words, District 2 has a poverty rate that is nearly five times that of District 1. However, District 2’s EFIG per-formula child allocation is 14.2% less and its Targeted Grant per-formula child allocation is 8.5% less than those of District 3.
Small State Minimum Requirements
Small state minimum requirements ensure that each state receives a minimum level of funding from each formula, i.e., regardless of population, there is a minimum amount each state must receive. This leads to an outsized benefit for states with lower populations because it results in the per-formula child allocation being higher than it would be without the requirements.33See Title I of ESEA: How the Formulas Work. Figures 2-3 and 9-11 in Title I of ESEA: How the Formulas Work show how the use of the small state minimum requirements affect Title I allocations.
Hold Harmless Provisions
Hold harmless provisions ensure that when a district’s formula child count declines, its Title I allocation declines more slowly. In other words, should a district see a decline in enrollment or some other rapid change in the number of formula children, the effect on its allocation is tempered by hold harmless provisions. Current levels range from 85% to 95% of the previous year’s total Basic Grant allocation which steadies the allocation over time.34See Title I of ESEA: How the Formulas Work. Figures 4-5, 7-8, and 16-18 in Title I of ESEA: How the Formulas Work demonstrate the impact of hold harmless provisions on LEA Title I allocations.
Poverty Quintiles
As described above, each LEA’s weighted formula child count used in the Targeted Grant and EFIG formulas is determined based on the higher of two calculations: (1) number weighting, which considers the number of children from low-income families in an LEA, and (2) percentage weighting, which considers the poverty rate of an LEA. However, the formula child count calculation using percentage weighting assigns weights that are linked to poverty quintiles explicitly written into law based on data from 2001 (during the passage of NCLB). The percentage weighting calculation provides higher formula child weights to LEAs with higher poverty rates, just as the calculation using number weighting provides higher formula child weights to LEAs with higher numbers of children from low-income families.
As Table 6 demonstrates, due to decreases in child poverty, only 24.3% of formula children were enrolled in LEAs in FY 2020 that could have received weights assigned to the two highest quintiles, instead of 40%, as originally designed. Consequently, LEAs whose weighted formula child count would have previously incorporated a higher weight now are limited to using a lower weight and are not as well-positioned to receive Title I funds. Further, because the weighted formula child count in the Targeted Grant and EFIG formulas may also be calculated based on the total number of formula children in an LEA (i.e., number weighting), the decline in poverty rates has had an especially adverse effect on small, high-poverty LEAs, since larger LEAs can take advantage of number weighting to maintain a high weighted formula child count.
Table 6. Share of ESEA Title I Funds Allocated to LEAs by Poverty Rate Quintile, FY 2020, Applying Quintile Thresholds Set in the ESEA Statute
Title I Formula | Poverty Rates <15.58% | Poverty Rates ≥15.58% but <22.11% | Poverty Rates ≥22.11% but <30.16% | Poverty Rates ≥30.16% but <38.24% | Poverty Rates ≥38.24% |
Percentage of Children Counted in Title I Allocation Formulas for FY 2020 | 25.1% | 25.7% | 24.9% | 15.8% | 8.5% |
Percentage Share of Total Grants | |||||
Total Title I Grants, FY 2020 | 21.7% | 24.3% | 26.1% | 18.0% | 9.9% |
Basic Grants (39.6% of FY 2020 Appropriations) | 26.2% | 24.8% | 24.4% | 15.8% | 8.8% |
Concentration Grants (8.4% of FY 2020 Appropriations) | 13.6% | 29.1% | 28.5% | 18.5% | 10.3% |
Targeted Grants (26.0% of FY 2020 Appropriations) | 19.8% | 24.0% | 26.8% | 19.1% | 10.3% |
Education Finance Incentive Grants (26.0% of FY 2020 Appropriations) | 19.1% | 22.3% | 27.2% | 20.1% | 11.3% |
Notes: Table reads, for example: The overall percentage of regular schools with a low-income student percentage of 30.000–39.999% that participated in ESEA Title I during the 2018–19 school year was 41.2%. For regular schools differentiated by school level, the Title I participation rate during the 2018–19 school year for schools with a low-income student percentage of 30.000–39.999% was 7.2% for pre-K schools, 58.7% for elementary schools, 28.0% for middle schools, 19.3% for high schools, 13.2% for secondary schools, and 64.0% for other schools. Participation rates may be lower in pre-K schools because of the availability of other funding programs, e.g., Head Start, to support these schools. *Percentage of all regular schools meeting the selection criteria that participated in ESEA Title I during the 2018–19 school year. | |||||
As shown in Table 7, if the poverty quintiles used to produce weighted child counts (via percentage weighting) in the Targeted Grant and EFIG formulas were updated based on current poverty rates, 40% of formula children would be in LEAs using weights associated with the two highest poverty quintiles, increasing the number of LEAs using higher weights. The number of formula students who would be enrolled in LEAs that would use a weight associated with the second highest poverty quintile would increase by 4.2 percentage points. Likewise, the number of students enrolled in LEAs that could potentially apply the weight associated with the highest poverty quintile would increase by 11.5 percentage points. This would make the Targeted Grants and EFIG more targeted while the underlying formulas themselves remain the same.
Table 7. Share of ESEA Title I Funds Allocated to LEAs by Poverty Rate Quintile, FY 2020, Applying Quintile Thresholds Based on FY 2020 Allocation Data
Title I Formula | Poverty Rates <13.96% | Poverty Rates ≥13.96% but <19.25% | Poverty Rates ≥19.25% but <24.64% | Poverty Rates ≥24.64% but <32.07% | Poverty Rates ≥32.07% |
Percentage of Children Counted in Title I Allocation Formulas for FY 2020 | 20.0% | 20.0% | 20.0% | 20.0% | 20.0% |
Percentage Share of Total Grants | |||||
Total Title I Grants, FY 2020 | 16.7% | 19.0% | 19.2% | 21.5% | 23.5% |
Basic Grants (39.6% of FY 2020 Appropriations) | 20.9% | 19.7% | 19.2% | 19.7% | 20.5% |
Concentration Grants (8.4% of FY 2020 Appropriations) | 8.1% | 22.4% | 22.4% | 23.1% | 23.9% |
Targeted Grants (26.0% of FY 2020 Appropriations) | 15.1% | 18.7% | 19.0% | 22.5% | 24.7% |
Education Finance Incentive Grants (26.0% of FY 2020 Appropriations) | 14.7% | 17.4% | 18.6% | 22.6% | 26.8% |
Percentage of Children Counted in Title I Allocation Formulas for FY 2020 | 20.0% | 20.0% | 20.0% | 20.0% | 20.0% |
Notes: Table reads, for example: 20% of formula children reside in the LEAs in the quintile with the highest school-age child poverty rate (children counted under the ESEA Title I allocation formulas as a percentage of all children aged 5 to 17 years), applying quintile thresholds based on FY 2020 allocation data. These LEAs would receive 23.5% of total FY 2020 ESEA Title I grants, including 20.5% of all funds allocated as Basic Grants; 23.9% of all funds allocated as Concentration Grants; 24.7% of all funds allocated as Targeted Grants; and 26.8% of all funds allocated as Education Finance Incentive Grants. | |||||
The Role of Congressional Allocation
Although the Targeted Grant and EFIG formulas support higher poverty schools by using a weighted formula child count and, in the case of EFIG, the state Equity and Effort Factors, roughly 38% of all Title I funds are still allocated via the Basic Grant formula, limiting the degree to which Title I funding overall is targeted to high-poverty districts. Another way to increase targeting in the program would be to shift the percentage of funds allocated to the Basic Grant in favor of the more progressive formulas. Though this could occur by decreasing—or eliminating—the investment in Basic Grants, doing so may result in lower-poverty LEAs losing some, or all, of their Title I funding, which may not be politically feasible because those with a net loss for their school constituencies would not support such changes.
Further, while the eligibility criteria differ only slightly between Basic Grant, Targeted Grant, and EFIG formulas (the latter two require LEAs to have 10 formula children and a 5% poverty rate instead of a 2% poverty rate), the Basic Grant eligibility criteria have enabled nearly every district to benefit from the Title I program, which is a significant factor in establishing and maintaining the program’s popularity over time. The widespread receipt of Title I funds also enabled other program requirements (e.g., school accountability systems and publishing annual data on student learning) to be effective tools for policy change across states and districts. Rather than decreasing funding for Basic Grants, a more politically viable option could be for Congress to significantly increase its investment in the formulas that do a better job of targeting funds to high-poverty LEAs and to refine these formulas so their targeting is even more effective.35See Title I of ESEA: How the Formulas Benefit Different Types of School Districts for an examination of how well each of the existing four formulas distribute funds to high-poverty LEAs.
Increasing the allocation for Title I in this manner could also support high-poverty schools within high-poverty districts. Given the way Title I funds are allocated by states to districts, and then by districts to schools, there is no mechanism for ensuring all of a state’s high-poverty schools are funded before funding is allocated to low-poverty schools.
As depicted above in Figure 5, it is likely that some high-poverty schools do not receive Title I funds because districts run out of money before they are able to fund all of their high-poverty schools. Recall that districts rank-order their schools from highest to lowest percentage of students from low-income families and then fund schools in order of their poverty rates. Districts determine the amount of funds to provide each school; there is no requirement to provide a set amount per pupil or for districts to provide funds to each school within a particular poverty rate range. Thus, to provide a meaningful level of funding to some high-poverty schools, it is likely that high-poverty districts lack sufficient Title I allocations to provide Title I grants to all of their high-poverty schools, especially in districts with many high-poverty schools.
In Review
From analyzing how Title I funds are distributed across school districts, across its four formulas, across schools, and across schools of different grade spans, there are clear opportunities for policymakers to better target these funds to communities and schools with the highest concentrations of poverty:
- More than 70% of Title I funds are allocated to school districts with a poverty rate below 30%.
- Even though new formulas were intended to distribute funds more progressively, the percentage of Title I funds allocated to districts with the highest levels of poverty is only marginally higher for Concentration Grants, Targeted Grants, and EFIG (4.4, 4.8, and 6.9 percentage points, respectively) than for the original Basic Grant.
- More than 25% of schools with 10% or fewer children from low-income families receive Title I funds.
- Although nearly all elementary and middle schools with the highest percentages (90% and above) of children from low-income families get Title I funding, only 76.6% of similar high schools receive Title I.
- 1,144 schools with the very highest concentrations of poverty (90% and above) are overlooked for Title I funding, while 1,188 schools with relatively small percentages of students from low-income families (10% and below) receive funds.
These patterns are not necessarily surprising after examining the Title I formulas more closely. Due to the eligibility criteria for the Basic Grant, and to a lesser extent the Targeted Grant and EFIG programs, nearly every district in the country receives Title I funds, even if it has as few as 10 eligible children and a poverty rate as low as 2%. While this has given the program broad-based political support over time and enabled the program to grow to nearly $18 billion in FY 2022, it creates challenges for policymakers seeking to better target those funds to districts and schools with the highest concentrations of poverty.
- Districts vary greatly in size and number among the states, which can influence whether high-poverty schools are likely located in high-poverty districts or whether high-poverty schools are located in districts with average or below-average poverty rates. As we discuss, some of the more targeted Title I formulas (via the use of number weighting, based on outdated poverty quintiles, to produce a weighted child count) enable districts with larger child populations to receive more Title I funding per formula child compared to smaller districts with the same formula child share. These dynamics may make it easier for large districts to fund most of their high-poverty schools relative to smaller districts—and warrant consideration for policymakers debating potential changes to the weights and brackets used in Targeted Grants and EFIG to better target high-poverty districts.
- In seeking to account for differences in the cost of education across states by incorporating a measure of state spending into the formulas, Title I tends to send more money, all else equal, to states with higher adjusted spending per pupil—states which also tend to have lower concentrations of poverty. This may make it more challenging, in particular, for districts in low-spending states to provide Title I funds to all of their high-poverty schools. Policymakers should study whether alternative approaches to accounting for differences in cost across states would result in more progressive distribution of Title I funds.
Altogether, these dynamics mean that policymakers need to consider multiple factors within the formulas and how they interact (i.e., district and school eligibility criteria, the weights and brackets used to calculate the weighted formula child count, and the use of adjusted state spending per pupil) as they seek to identify ways to better target Title I funds to high-poverty schools and students with the greatest needs.
Conclusion
Nearly 60 years after its passage, the foundation of ESEA’s—Title I—supports the education of more than 26 million children—nearly 36% of students.36See https://datacenter.kidscount.org/data/tables/8418-children-in-title-i-schools-by-race-and-ethnicity#detailed/1/any/false/1696,1648,1603,1539,1381,1246,1124,1021,909,857/167,168,133,3,185,107/17042 (accessed October 6, 2022). Any investment in Title I not only supports the educational progress of students from low-income families, it also supports the closing of opportunity gaps for three in four Black, Latinx, and American Indian or Alaska Native children.37Based on an analysis of children in Title I schools in school year 2018–19 and all children aged 5 to 17 years in 2019 disaggregated by race. 72.6% of all American Indian or Alaska Native children, 74.3% of all Black children, and 71.7% of all Latinx children in this age group attended at Title I school. Policymakers can be champions for systemic change for children of color when they support improving and bolstering Title I.
Over its history, millions of children have benefited from the additional supports that Title I has funded. Although the most recent Long-term National Assessment of Educational Progress scores showed a marked decline in scores postpandemic, past data showed a consistent rise in scores for all student groups since 1971.38See https://www.nationsreportcard.gov/ltt/?age=9 (accessed January 11, 2023).The data for children from low-income families 39National Assessment of Educational Progress uses participation in the Free and Reduced-Price Lunch Program as a measure of socioeconomic status and has reported disaggregated scores by this measure since 2004.and children of color also shows consistent gains. Title I has transformed public education despite its imperfections. Now is the time to fulfill the dream of Title I. As Lyndon B. Johnson said in 1965:40L. B. Johnson, remarks after signing bill providing funds for the programs under the Elementary and Secondary Education Act, White House Theater, September 23, 1965, https://www.presidency.ucsb.edu/documents/remarks-after-signing-bill-providing-funds-for-programs-under-the-elementary-and-secondary (accessed October 6, 2022).
I hope that not a single day will be lost. For in education, the time we waste today can mean a life wasted tomorrow. We have always believed that our people can stand on no higher ground than the school ground or can enter any more hopeful room than the classroom. We blend time and faith and knowledge in our schools–not only to create educated citizens, but also to shape the destiny of this great Republic.
Figure 6. Proportion of Participating Schools by Poverty Rate
Figure 7. Number of Schools Receiving Title I Funding, Highest-Income vs. Highest-Poverty Schools, by State
Table 8. Percentage of Schools Receiving Title I Funding, Highest-Income v. Highest-Poverty Schools, by State
State | Funded (Under 10.00%) | Not Funded (Under 10.00%) | Total Funded (Under 10.00%) | Funded (Over 90.00%) | Not Funded (Over 90.00%) | Total Funded (Over 90.00%) |
Alabama | 0 | 27 | 0.00% | 127 | 2 | 98.45% |
Alaska | 35 | 29 | 54.69% | 136 | 6 | 95.77% |
Arizona | 1 | 52 | 1.89% | 153 | 7 | 95.63% |
Arkansa | 2 | 6 | 25.00% | 222 | 37 | 85.71% |
California | 47 | 304 | 13.39% | 1615 | 8 | 99.51% |
Colorado | 3 | 207 | 1.43% | 88 | 2 | 97.78% |
Connecticut | 30 | 54 | 35.71% | 11 | 2 | 84.62% |
Delaware | 2 | 4 | 33.33% | 20 | 4 | 83.33% |
Florida | 10 | 129 | 7.19% | 291 | 42 | 87.39% |
Georgia | 10 | 90 | 10.00% | 693 | 21 | 97.06% |
Hawaii | 0 | 4 | 0.00% | 3 | 0 | 100.00% |
Idaho | 22 | 44 | 33.33% | 18 | 2 | 90.00% |
Illinois | 92 | 164 | 35.94% | 426 | 71 | 85.71% |
Indiana | 3 | 30 | 9.09% | 53 | 12 | 81.54% |
Iowa | 4 | 26 | 13.33% | 15 | 0 | 100.00% |
Kansas | 2 | 57 | 3.39% | 33 | 3 | 91.67% |
Kentucky | 3 | 14 | 17.65% | 14 | 17 | 45.16% |
Louisiana | 6 | 4 | 60.00% | 60 | 2 | 96.77% |
Maine | 4 | 11 | 26.67% | 4 | 0 | 100.00% |
Maryland | 0 | 129 | 0.00% | 172 | 66 | 72.27% |
Massachusetts | 38 | 102 | 27.14% | 339 | 26 | 92.88% |
Michigan | 6 | 67 | 8.22% | 283 | 29 | 90.71% |
Minnesota | 92 | 8 | 92.00% | 73 | 3 | 96.05% |
Mississippi | 0 | 0 | 0.00% | 407 | 13 | 96.90% |
Missouri | 3 | 45 | 6.25% | 343 | 62 | 84.69% |
Montana | 13 | 6 | 68.42% | 7 | 1 | 87.50% |
Nebraska | 2 | 30 | 6.25% | 29 | 3 | 90.63% |
Nevada | 0 | 12 | 0.00% | 210 | 19 | 91.70% |
New Hampshire | 21 | 53 | 28.38% | 2 | 0 | 100.00% |
New Jersey | 234 | 307 | 43.25% | 86 | 6 | 93.48% |
New Mexico | 3 | 13 | 18.75% | 475 | 30 | 94.06% |
New York | 105 | 163 | 39.18% | 477 | 25 | 95.02% |
North Carolina | 19 | 86 | 18.10% | 752 | 128 | 85.45% |
North Dakota | 4 | 8 | 33.33% | 22 | 10 | 68.75% |
Ohio | 278 | 300 | 48.10% | 851 | 111 | 88.46% |
Oklahoma | 0 | 5 | 0.00% | 171 | 16 | 91.44% |
Oregon | 2 | 33 | 5.71% | 18 | 6 | 75.00% |
Pennsylvania | 28 | 110 | 20.29% | 655 | 53 | 92.51% |
Rhode Island | 5 | 21 | 19.23% | 16 | 0 | 100.00% |
South Carolina | 0 | 29 | 0.00% | 416 | 111 | 78.94% |
South Dakota | 2 | 9 | 18.18% | 58 | 9 | 86.57% |
Tennessee | 15 | 64 | 18.99% | 309 | 6 | 98.10% |
Texas | 11 | 252 | 4.18% | 1521 | 110 | 93.26% |
Utah | 3 | 77 | 3.75% | 39 | 8 | 82.98% |
Vermont | 1 | 2 | 33.33% | 3 | 0 | 100.00% |
Virginia | 1 | 118 | 0.84% | 154 | 40 | 79.38% |
Washington | 5 | 168 | 2.89% | 53 | 6 | 89.83% |
West Virginia | 0 | 0 | 0.00% | 0 | 1 | 0.00% |
Wisconsin | 21 | 64 | 24.71% | 63 | 4 | 94.03% |
Wyoming | 0 | 11 | 0.00% | 7 | 4 | 63.64% |
Grand Total | 1188 | 3548 | 25.08% | 11993 | 1144 | 91.29% |
The table shows the number of schools receiving and not receiving Title I funding by percentage of students from low-income families. The table also shows the total percentage of schools receiving Title I funding by percentage of students from low-income famies. The green text indicates the states where all the schools with a poverty rate above 90% receive Title I funds. The purple text indicates the states where none of schools with a poverty rate under 10% receive Title I funds but some of their schools with the highest poverty rate do not receive the funding. | ||||||
High schools are less likely to receive Title I funds than elementary and middle schools for several reasons. First, high schools tend to be more heterogenous than elementary and middle schools. High schools enroll students from across a school district, including feeder elementary and middle schools with high and low percentages of children from low-income families. Therefore, the percentage of children from low-income families within a high school may be lower than several of its feeder elementary and middle schools.
In addition, ESEA allows LEAs to prioritize elementary and middle schools over high schools. When Title I funds are insufficient to serve all eligible schools within an LEA, they must rank the schools, without regard for grade spans, by the concentration of poverty. LEAs are required to fund schools in order of poverty level down to 75%, at which point an LEA may choose to fund their remaining schools by grade span. This allows elementary and middle schools with lower percentages of children from low-income families to receive Title I funds before funding high schools with higher levels of poverty.
ESSA attempted to address the low level of Title I funding received by high schools by allowing (though not requiring) LEAs to fund high schools with a concentration of children from low-income families of 50% after funding all schools in order of poverty down to 75%.41For additional information on Title I funding in high schools, see https://all4ed.org/publication/title-i-and-high-schools-addressing-the-needs-of-disadvantaged-students-at-all-grade-levels/ (accessed October 6, 2022).
It appears this policy has had little effect. Participation in Title I, even in schools with the highest poverty rates, is far lower in the upper grade spans than in elementary schools. For example, in the highest-poverty schools (those with poverty rates above 90%), only 56.8% of secondary schools and 76.6% of high schools participated in Title I compared to 97.9% of elementary schools and 93.1% of middle schools.
One way to view the level of targeting provided under the Targeted Grant and Education Finance Incentive Grant (EFIG) formulas is to examine the average grant per formula child for high-poverty LEAs versus state averages. The following table provides the Title I grant per formula child, by formula, for the 15 LEAs in the nation with the largest number of formula children for FY 2020. The table also provides these statistics for the LEA with the highest poverty rate in these states plus the state average grants per formula child, by formula. LEAs are compared with others in the same state to adjust for variations in grants per child arising from statewide factors such as the expenditure factor used in all formulas plus the Effort and Equity Factors of the EFIG formula.
Table 9. ESEA Title I: Illustration of the Allocation of Funds to the Nation’s 15 Largest LEAs* Compared to Other LEAs in the Same State#, FY 2020
ESEA Title I Formula Child(ren) | Grants Per Formula Child, FY 2020 | |||||||
State | LEA | Total ESEA Title I Formula Children | ESEA Title I Formula Child Percentage | Total Title I Grant Per Formula Child | Basic Grant Per Formula Child | Concentration Grant Per Formula Child | Targeted Grant Per Formula Child | EFIG Per Formula Child |
CA | Los Angeles Unified School District | 171,959 | 24.6% | $2,377 | $676 | $167 | $731 | $804 |
Richgrove Elementary School District | 312 | 46.1% | $2,065 | $704 | $173 | $601 | $587 | |
State Total/Average | 1,126,776 | 17.2% | $1,773 | $709 | $151 | $482 | $432 | |
Total/Average for All Other LEAs in the State | 954,505 | 16.3% | $1,664 | $714 | $148 | $437 | $365 | |
FL | Dade County School District | 86,671 | 21.7% | $1,767 | $562 | $139 | $581 | $484 |
Broward County School District | 50,324 | 16.8% | $1,681 | $559 | $138 | $536 | $447 | |
Hillsborough County School District | 43,649 | 18.6% | $1,653 | $559 | $138 | $521 | $434 | |
Orange County School District | 48,340 | 21.8% | $1,676 | $560 | $138 | $533 | $444 | |
Gadsden County School District | 3,162 | 43.0% | $1,543 | $563 | $139 | $458 | $382 | |
State Total/Average | 582,417 | 18.9% | $1,581 | $569 | $138 | $476 | $397 | |
Total/Average for All Other LEAs in the State | 350,271 | 18.2% | $1,499 | $575 | $138 | $428 | $358 | |
IL | Chicago Public School District 299 | 93,895 | 23.6% | $2,912 | $843 | $208 | $877 | $984 |
West Harvey-Dixmoor Public School District | 685 | 44.2% | $2,422 | $845 | $209 | $703 | $665 | |
State Total/Average | 323,064 | 15.4% | $2,068 | $856 | $171 | $546 | $496 | |
Total/Average for All Other LEAs in the State | 228,484 | 13.5% | $1,725 | $863 | $156 | $410 | $296 | |
MI | Detroit Public Schools Community District | 57,118 | 46.7% | $2,363 | $671 | $166 | $659 | $867 |
Hamtramck Public Schools | 2,501 | 58.0% | $2,352 | $671 | $166 | $667 | $847 | |
State Total/Average | 289,256 | 18.2% | $1,702 | $683 | $138 | $418 | $464 | |
Total/Average for All Other LEAs in the State | 229,637 | 15.7% | $1,531 | $686 | $130 | $355 | $360 | |
NV | Clark County School District | 70,835 | 18.8% | $1,692 | $560 | $138 | $566 | $428 |
Mineral County School District | 152 | 23.9% | $1,13 | $563 | $139 | $281 | $147 | |
State Total/Average | 86,707 | 17.2% | $1,606 | $564 | $136 | $521 | $385 | |
Total/Average for All Other LEAs in the State | 15,720 | 12.6% | $1,222 | $579 | $127 | $323 | $192 | |
NY | Bronx County | 92,685 | 36.7% | $2,717 | $850 | $208 | $876 | $782 |
Kings County | 104,682 | 26.1% | $2,732 | $843 | $208 | $886 | $795 | |
Queens County | 47,331 | 14.9% | $2,529 | $843 | $208 | $800 | $678 | |
Kiryas Joel Village Union Free School District | 3,630 | 49.8% | $2,440 | $845 | $209 | $767 | $619 | |
State Total/Average | 526,148 | 18.0% | $2,273 | $870 | $187 | $670 | $547 | |
Total/Average for All Other LEAs in the State | 277,820 | 14.3% | $1,906 | $891 | $168 | $496 | $351 | |
PA | Philadelphia City School District | 85,166 | 35.5% | $2,938 | $843 | $208 | $869 | $1,018 |
Farrell Area School District | 391 | 48.2% | $2,595 | $845 | $209 | $751 | $790 | |
State Total/Average | 316,231 | 16.3% | $2,095 | $859 | $167 | $535 | $534 | |
Total/Average for All Other LEAs in the State | 230,674 | 13.5% | $1,783 | $865 | $152 | $411 | $356 | |
TN | Shelby County School District | 45,797 | 34.8% | $1,842 | $561 | $139 | $529 | $613 |
Rogersville City Schools | 183 | 42.4% | $1,630 | $563 | $139 | $452 | $475 | |
State Total/Average | 223,766 | 20.3% | $1,468 | $571 | $133 | $380 | $385 | |
Total/Average for All Other LEAs in the State | 177,786 | 18.4% | $1,371 | $573 | $131 | $341 | $325 | |
TX | Houston Independent School District | 78,882 | 31.3% | $1,821 | $559 | $138 | $572 | $552 |
Dallas Independent School District | 51,854 | 26.4% | $1,748 | $557 | $138 | $536 | $517 | |
Roma Independent School District | 2,947 | 51.3% | $1,728 | $563 | $139 | $522 | $503 | |
State Total/Average | 1,095,848 | 20.4% | $1,483 | $566 | $127 | $402 | $388 | |
Total/Average for All Other LEAs in the State | 962,165 | 19.6% | $1,441 | $567 | $125 | $380 | $367 | |
Notes: * These are the 15 LEAs in the nation with the largest number of children aged 5 to 17 years that are counted in the ESEA Title I allocation formulas for FY 2020 grants. # The comparison LEAs are (a) all those in the same state; (b) all LEAs in the same state except those listed individually; and (c) the LEA in the same state with the highest ESEA Title I formula child percentage (excluding LEAs with fewer than 100 Title I formula children, and LEAs where Title I grants have been substantially increased due to hold harmless provisions). In the table above, Basic and Concentration Grants per formula child are approximately the same for all LEAs in the same state (assuming minimum LEA eligibility criteria are met); variations in grants per formula child result primarily from hold harmless effects. However, LEAs that are among the 15 largest in the nation receive much higher grants per formula child than other LEAs in the same state under the Targeted Grant and EFIG formulas. For the largest LEA(s) in the states shown in the table, Targeted Grants per formula child are in many cases almost twice as high as the average for all other LEAs in the state, while EFIG per formula child are in some cases more than twice as high as the average for all other LEAs in the state. In most cases, the Targeted Grants and EFIG per formula child are higher than the state average for LEAs in each state having the highest poverty rate, although in most cases not as high as for the LEA(s) with the largest number of formula children. This reflects a general pattern whereby the Targeted Grant and EFIG formulas are favorable to LEAs with both high numbers of formula children and high poverty rates, but generally somewhat more favorable to the former. A major reason for this pattern is that LEAs with large numbers of formula children are often able to apply relatively high weights to higher proportions of their formula children than are smaller LEAs with relatively high percentages of formula children. | ||||||||
Another perspective on the impact of the Targeted Grant and EFIG formulas on different types of LEAs is provided in the table above. It again focuses on different types of LEAs in the same state, to eliminate the influence of statewide formula factors, especially the expenditure factor. (A comparison of the LEAs with the highest numbers of formula children and the highest school-age child poverty rates nationwide (i.e., across states) would show greater variation in grants per formula child between these two groups of LEAs. However, those differences would result largely from differences in state expenditure factors, especially as LEAs with the nation’s highest poverty rates are often located in states with low expenditure factors.)
The table compares state average grants per formula child, by formula, with grants per formula child to three types of LEAs: (1) LEAs with relatively large numbers, but relatively low percentages, of formula children, (2) LEAs with relatively large numbers and above-average percentages of formula children, and (3) LEAs with percentages of formula children that are among the highest in the state. LEAs in these categories are compared in three states—Florida, Maryland, and Virginia—that have a number of LEAs in each of these categories. The general pattern seen in this table for these states is that LEAs in both of the first two categories—LEAs with relatively large numbers, but relatively low percentages, of formula children and LEAs with relatively large numbers and above-average percentages of formula children—invariably receive Targeted Grants, EFIG, and total grants per formula child that are significantly above the state average.
LEAs that have the state’s highest percentages of formula children also receive higher than average grants in Virginia, but not in Florida or Maryland. This is another reflection of the way in which even moderately high numbers of formula children can substantially influence the distribution of Targeted Grants and EFIG Grants, even for LEAs that have very low school-age child poverty rates by national standards (such as Montgomery County, MD, and Fairfax County, VA). Thus, while the Targeted Grant and EFIG formulas are not sharply biased against relatively small LEAs with high poverty rates, LEA size (in terms of numbers of formula children) can have greater influence on allocation patterns than poverty rates.
Table 10. Illustration of the Effect of the ESEA Title I Allocation Formulas on LEAs with Relatively High or Low Numbers or Percentages of Formula Children, FY 2020
State and LEA | Total Formula Children | Formula Child Percentage | Grants per Formula Child, FY 2020 | ||||
Total Title I Grant | Basic | Concentration Grant | Targeted Grant | EFIG | |||
Florida | |||||||
LEAs with relatively large numbers but relatively low percentages of formula children | |||||||
Broward County School District | 50,324 | 16.8% | $1,681 | $559 | $138 | $536 | $447 |
Palm Beach County School District | 35,701 | 17.2% | $1,612 | $561 | $139 | $498 | $415 |
LEAs with relatively large numbers and above-average percentages of formula children | |||||||
Dade County School District | 86,671 | 21.7% | $1,767 | $562 | $139 | $581 | $484 |
LEAs with very high percentages of formula children | |||||||
Gadsden County School District | 3,162 | 43.0% | $1,543 | $563 | $139 | $458 | $382 |
Highlands County School District | 5,121 | 38.9% | $1,466 | $563 | $139 | $416 | $347 |
State total/average | 582,417 | 18.9% | $1,581 | $569 | $138 | $476 | $397 |
Maryland | |||||||
LEAs with relatively large numbers but relatively low percentages of formula children | |||||||
Montgomery County Public Schools | 14,927 | 8.4% | $2,384 | $843 | $208 | $681 | $652 |
Prince George’s County Public Schools | 15,296 | 10.7% | $2,397 | $845 | $209 | $686 | $657 |
LEAs with relatively large numbers and above-average percentages of formula children | |||||||
Baltimore City Public Schools | 23,649 | 27.8% | $2,464 | $841 | $208 | $722 | $692 |
LEAs with very high percentages of formula children | |||||||
Somerset County Public Schools | 950 | 30.3% | $2,036 | $845 | $209 | $502 | $480 |
Dorchester County Public Schools | 1,227 | 24.5% | $1,897 | $845 | $209 | $430 | $412 |
State total/average | 113,950 | 11.7% | $2,229 | $847 | $172 | $618 | $592 |
Virginia | |||||||
LEAs with relatively large numbers but relatively low percentages of formula children | |||||||
Fairfax County Public Schools | 13,109 | 6.7% | $1,994 | $671 | $166 | $529 | $628 |
Richmond City Public Schools | 9,113 | 34.2% | $1,892 | $698 | $171 | $484 | $539 |
LEAs with very high percentages of formula children | |||||||
Petersburg City Public Schools | 1,783 | 40.4% | $1,957 | $671 | $166 | $515 | $604 |
Colonial Beach Town Public Schools | 168 | 36.1% | $1,920 | $698 | $171 | $494 | $558 |
State total/average | 173,635 | 12.8% | $1,596 | $677 | $128 | $387 | $404 |
- 1Elementary and Secondary Education Act of 1965, Public Law 89-10, 89th Cong. (1965).
- 2Brief Amicus Curiae on behalf of NAACP Legal Defense & Educational Fund, Inc. and the New York Civil Liberties Union, 2001 NY App. Div. Briefs 567, 19 (2001). (Paynter v. State)
- 3J. Anderson, D. Hollinger, and J. Conaty, “Poverty and Achievement: Reexamining the Relationship Between Poverty and Student Achievement,” ERS Spectrum 11, no. 2 (1993).
- 4Brief Amicus Curiae on behalf of NAACP Legal Defense & Educational Fund, Inc. and the New York Civil Liberties Union, 2001 NY App. Div. Briefs 567, 19 (2001).
- 5See https://kappanonline.org/political-case-history-passage-esea-guthrie/ (accessed October 6, 2022).
- 6The term “district” refers to local educational agencies and charter schools that are local educational agencies.
- 7In this analysis, “poverty rate” refers to census data whereas “percentage of low-income students” refers to poverty according to section 1113 of ESEA as the number of children eligible for a free or reduced-price lunch under the Richard B. Russell National School Lunch Act (42 U.S.C. 1751 et seq.), the number of children in families receiving assistance under the state program funded under part A of title IV of the Social Security Act, or the number of children eligible to receive medical assistance under the Medicaid program, or a composite of such indicators.
- 8In this analysis, “highest concentration” refers to the LEAs in the fifth quintile.
- 9A more detailed analysis of the formulas can be found in Title I of ESEA: How the Formulas Work.
- 10The formula child count is an estimate of children living in poverty in the United States. This is determined by using the Census Bureau’s Small Area Income Poverty Estimates program which provides annual estimates of income and poverty statistics for all school districts, counties, and states, the number of children who qualify for Temporary Assistance for Needy Families, and the number of children in foster care.
- 11Analysis of Department of Education Budget Tables and FY2023 Consolidated Appropriations Act
- 12R. Skinner and Leah Rosenstiel, Analysis of the Elementary and Secondary Education Act Title I-A Allocation Formulas: Factors, Design Elements, and Allocation Patterns, CRS Report R45141, Version 3. Updated (2018). R. Skinner, Title I Formulas: In Brief, CRS Report R44164, Version 4. Updated (2016). In the highest-spending states, the SPPE is adjusted to 120% of the national average per-pupil expenditure, while in low-spending states, the SPPE is adjusted up to 80% of the national average per-pupil expenditure level. However, EFIG uses a different method for adjusting SPPE, with an upper bound of 115% of national average per-pupil expenditure and a lower bound of 85%.
- 13See https://sgp.fas.org/crs/misc/R44461.pdf p.11–15 (accessed October 6, 2022).
- 14See https://sgp.fas.org/crs/misc/R44461.pdf p. 15–17 (accessed October 6, 2022).
- 15For information on other policies included in ESSA to increase Title I funding for high schools, see Appendix A.
- 16For additional information on the allocation of Title I funds within districts, including funding for private schools, see https://oese.ed.gov/files/2020/07/essaguidance160477.pdf (accessed October 6, 2022) and https://www2.ed.gov/programs/titleiparta/wdag.doc (accessed October 6, 2022).
- 17In this analysis, “children from low-income families” refers to formula-eligible children.
- 18For this analysis, “lower poverty LEAs” is defined as those with a poverty rate below 30% and “higher poverty LEAs” is defined as those with a poverty rate at or above 30%.
- 19Approximately 75% of formula-eligible children are in these school districts and 30% is the 90th percentile of poverty.
- 20LEA level poverty data is determined based on the Census Bureau’s Small Area Income and Population Estimates program, children living in foster care programs, and those receiving Temporary Assistance for Needy Families. For more information, see Title I of ESEA: How the Formulas Work.
- 21Data from the Common Core of Data (CCD) maintained by the National Center for Education Statistics.<br>Data includes regular schools only; it does not include special education or vocational schools. Within the CCD, a regular school is defined as a public elementary/secondary school providing instruction and education services that does not focus primarily on special education, vocational/technical education, or alternative education, or on any of the particular themes associated with magnet/special program emphasis schools.
- 22See Appendix A.
- 23In this analysis, schools with the highest concentration of poverty are those with a poverty rate of 90% or more.
- 24Hawaii is one large LEA.
- 25Vermont has 180 schools with ≥30.000% of students from low-income families Those not receiving funding are two schools between 50.000–59.999%, five schools between 40.000–49.999%, and 13 schools between 30.000–39.999%.
- 26Kentucky, 54.84% (17 of 31); Maryland, 27.73% (66 of 238); North Dakota, 31.25% (10 of 32); West Virginia, 100% (0 of 1); and Wyoming, 36.36% (4 of 11).
- 27At 100%, West Virginia has the highest percentage of schools with a percentage of students from low-income families of 90% that does not receive Title I. However, the state only has one school in this category
- 28Arizona and Virginia are the only states where only one high-income school participated.
- 29Montana (1 of 8) and West Virginia (1 of 1) are the only states where only one high-poverty school did not participate.
- 30[1] Alaska, Arizona, Arkansas, California, Colorado, Connecticut, Delaware, Florida, Georgia, Idaho, Illinois, Indiana, Kansas, Kentucky, Louisiana, Massachusetts, Michigan, Minnesota, Missouri, Montana, Nebraska, New Jersey, New Mexico, New York, North Carolina, North Dakota, Ohio, Oregon, Pennsylvania, South Dakota, Tennessee, Texas, Utah, Virginia, Washington, and Wisconsin.
- 31For most Title I grants, in the highest-spending states, the SPPE is adjusted to 120% of the national average per-pupil expenditure, while in low-spending states, the SPPE is adjusted up to 80% of the national average per-pupil expenditure level. However, EFIG uses a different method for adjusting SPPE, with an upper bound of 115% of national average per-pupil expenditure and a lower bound of 85%.
- 32R. Skinner and Leah Rosenstiel, “Analysis of the Elementary and Secondary Education Act Title I-A Allocation Formulas: Factors, Design Elements, and Allocation Patterns. CRS Report R45141, Version 3. Updated” (2018).
- 33
- 34
- 35See Title I of ESEA: How the Formulas Benefit Different Types of School Districts for an examination of how well each of the existing four formulas distribute funds to high-poverty LEAs.
- 36
- 37Based on an analysis of children in Title I schools in school year 2018–19 and all children aged 5 to 17 years in 2019 disaggregated by race. 72.6% of all American Indian or Alaska Native children, 74.3% of all Black children, and 71.7% of all Latinx children in this age group attended at Title I school.
- 38See https://www.nationsreportcard.gov/ltt/?age=9 (accessed January 11, 2023).
- 39National Assessment of Educational Progress uses participation in the Free and Reduced-Price Lunch Program as a measure of socioeconomic status and has reported disaggregated scores by this measure since 2004.
- 40L. B. Johnson, remarks after signing bill providing funds for the programs under the Elementary and Secondary Education Act, White House Theater, September 23, 1965, https://www.presidency.ucsb.edu/documents/remarks-after-signing-bill-providing-funds-for-programs-under-the-elementary-and-secondary (accessed October 6, 2022).
- 41For additional information on Title I funding in high schools, see https://all4ed.org/publication/title-i-and-high-schools-addressing-the-needs-of-disadvantaged-students-at-all-grade-levels/ (accessed October 6, 2022).
