Let’s Measure Ready: Key Differences in States’ College and Career Readiness Indicators
By Anne Hyslop, Director of Policy Development at All4Ed
This blog originally appeared on the Student Upward Mobility Initiative (SUMI) at the Urban Institute.
Ensuring high-quality education is part of a state’s commitment to a robust economy, thriving communities, and civic well-being. The National Governors Association (NGA), chaired by Colorado Governor Jared Polis, launched the Let’s Get Ready initiative to help states take up this charge. Given their work to identify the PK-12 skills and competencies that drive long-term economic success and mobility, SUMI was invited to play a strategic role supporting the Initiative, specifically focused on identifying what skills students need at the end of high school to be prepared for success. To provide that support, SUMI needed to understand how states currently measure college and career readiness, whether those measures have been robustly tied to long-term success, and where there is room for improvement. Given our expertise in state accountability systems and college and career pathways, SUMI asked All4Ed to join the team. Additional information about our collaboration with NGA can be found here.
Graduating students with the knowledge and skills they need for higher education and lifelong success should be a top priority for all state leaders. But how are states measuring whether their high school graduates are ready for what comes next? That’s one of the questions NGA asked SUMI and All4Ed to answer as part of Governor Polis’s Let’s Get Ready initiative.
In Let’s Measure Ready: A 50-State Analysis of College, Career, Military, and Civic Readiness Indicators, I found that 42 states currently use at least one college and career readiness (CCR) indicator for federal and state accountability. Alaska, Illinois, Kansas, Maine, Minnesota, Nebraska, New Jersey, Oregon, and Wisconsin do not use a CCR indicator currently. All states hold schools accountable for student performance across multiple indicators, per the federal Every Student Succeeds Act, but states can choose whether to use a CCR indicator. Some states have additional school accountability mandates in state law.
Despite the growing consensus around using CCR indicators, that consensus broke down when I examined the design, components, benchmarks, and transparencyof CCR indicators in use today. Unlike the federally required calculation of high school graduation rates (which enables cross-state comparisons), there is no shared calculation of postgraduation readiness, even though readiness is increasingly vital to measure because a high school diploma is generally not enough to secure a well-paying job and economic self-sufficiency.
Design
States have discretion to design their CCR indicators and how they are calculated. The most common approach, used in 36 states, is to treat all measures in the indicator interchangeably, even if they emphasize different areas of readiness. For example, Maryland students are counted in the indicator’s numerator if they complete any one of 10 measures (e.g., earning an ACT composite score of 21 or an industry certification). In these states, the overall percentage of “ready” students can be instructive, but leaders also need data on students completing each option to understand which students are prepared for which postsecondary pathways (e.g., community college versus four-year university enrollment). Less common design choices include indicators based on a single measure (8 states) or an index (6 states) that weighs certain measures more heavily.
Components
States also have discretion to choose the components, or measures and data points, in their indicators. Thirty-nine states include both college and career readiness measures, and 20 of these states also measure military or civic readiness. Advanced Placement (AP) and International Baccalaureate (IB) coursework and exams are the most common college readiness measure (35 states). There is more variation in career readiness measures, but the most popular is acquisition of industry-recognized credentials (23 states). And of the 20 states that measure military or civic readiness, 13 states include the Armed Forces Qualification Test (AFQT) portion of the Armed Services Vocational Aptitude Battery (ASVAB).
Figure 1
Which States Measure College, Career, or Military and Civics Readiness in Their CCR Indicators?
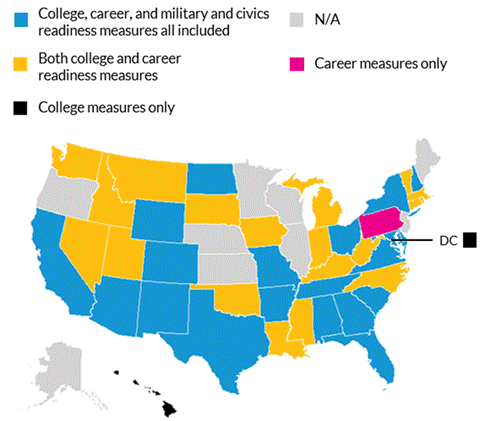
Source: Anne Hyslop, Let’s Measure Ready: a 50-State Analysis of College, Career, Military, and Civic Readiness Indicators (Washington, DC: Urban Institute, 2025).
Note: CCR = college and career readiness.
While the measures states use are generally associated with positive long-term outcomes, only 16 states include a post–high school outcome in their CCR indicators. The rest use only measures collected while students are in high school, such as completing a CTE pathway. These proxies might predict positive long-term outcomes, but actual high school outcomes are available and could be used instead. Career outcomes are the least likely to be included in CCR indicators (4 states). This is an area of opportunity for states, particularly, to improve collection of noncollege outcomes in the workforce, apprenticeships or other vocational training, and the military and to limit the proxy measures used to those with the strongest evidence base. Eight states include a military outcome (enlistment), but all of them rely on less-reliable, self-reported data.
FIGURE 2
Which States Include Student Postsecondary Outcome Measures in Their CCR Indicators?
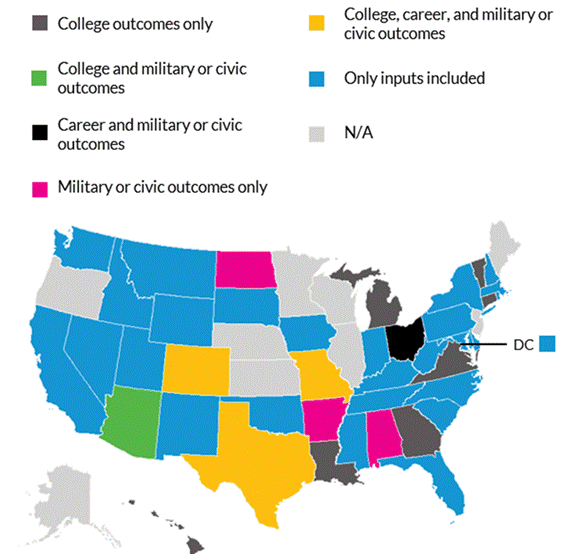
Source: Anne Hyslop, Let’s Measure Ready: a 50-State Analysis of College, Career, Military, and Civic Readiness Indicators (Washington, DC: Urban Institute, 2025).
Notes: N/A = not applicable. Outcomes include data gathered after students have completed high school (e.g., college enrollment or employment) or acquisition of postsecondary credentials (e.g., associate degrees) during high school.
Benchmarks
Although many CCR measures are common across states, states set different benchmarks—or the level of performance on each measure that is “good enough”—in their CCR indicators. For example, AFQT scores counted in states’ indicators range from a 31 (i.e., the 31st percentile) to an 88, and students get partial credit for taking the ASVAB in one state. A 31 is the minimum score to enlist but will generally not lead to recruits having a wide range of military job choices, nor being eligible for enlistment incentives. This kind of variation in benchmarks is seen on nearly every CCR measure, especially among career and military or civic readiness measures. The exception is AP exams: all 28 states that use AP exam performance expect students to earn at least a 3 (out of 5). Moving forward, state leaders could work together to identify the benchmarks most strongly associated with postsecondary success and shift to using those benchmarks in their indicators.
FIGURE 3
What Benchmark Scores Do States Use on the AFQT in Their CCR Indicators?
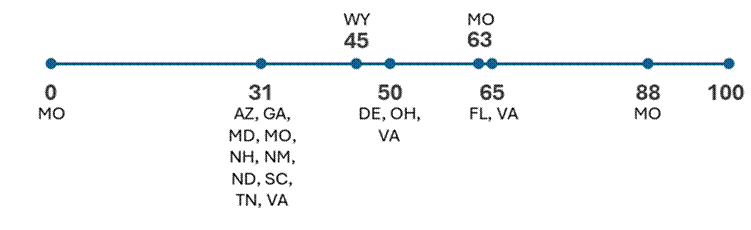
Source: Anne Hyslop, Let’s Measure Ready: a 50-State Analysis of College, Career, Military, and Civic Readiness Indicators (Washington, DC: Urban Institute, 2025).
Notes: AFQT = Armed forces Qualification Test. Missouri and Virginia are associated with multiple benchmarks because they use an index design that awards partial credit, full credit, or bonus points based on various AFQT scores. Full credit, or 1 point, in Missouri is awarded for a score of 63, while it takes a 65 to earn a full point in Virginia.
Transparency
The final area of variation is how transparently CCR indicators are reported. Just 12 states publicly report how students demonstrated readiness among the various CCR measures in their indicators, making improved data reporting another clear area of opportunity for state leaders. With most states using CCR indicators that treat each measure of readiness interchangeably, simply reporting the overall rate of ready students might mask significant disparities in access to college and career readiness experiences. For example, All4Ed explored the data for a California high school where 75 percent of Asian and Hispanic students were considered “prepared,” but most Asian students did so by meeting the course requirements for admission to state universities, while the school’s Hispanic students did so by earning a Seal of Biliteracy. These differences were identified only because the state disaggregated its CCR indicator data.
The inclusion of CCR indicators in nearly every state’s accountability system is worth celebrating. But when viewed holistically, my findings related to the design, components, benchmarks, and transparency of state CCR indicators also highlight several areas for continued state leadership. These include the following:
- publicly disaggregating CCR indicators by each specific measure through which readiness was demonstrated, including for each student group
- building an integrated P-20W data system to measure long-term outcomes, including links to employment records and wage data and military enlistment data
- working collaboratively to understand which benchmarks are associated with stronger student outcomes and using those benchmarks more consistently across states
Download Let’s Measure Ready: A 50-State Analysis of College, Career, Military, and Civic Readiness Indicators to explore all my findings and learn more about your state’s CCR indicators. To view the rest of our work in support of Let’s Get Ready, check out Kristin Blagg’s blog post and corresponding literature review, an overarching summary and recommendations from Karishma Furtado and Maggie Reeves, and SUMI’s work more broadly. Finally, the entire playbook for the Let’s Get Ready Initiative can be found here.
Meet The Author

Anne Hyslop
Director of Policy Development
